How I solved a memory leak in a NodeJS worker
My first challenge in my current job was to solve a memory leak in a NodeJS worker on Heroku that existed for about 2 years. Back then it was not a big deal since Heroku restarts the server every 24 hours and the volume of users was not significant. The problem is that it was now crashing sometimes twice a day and affecting performance and the user experience.
I hadn’t attempted this kind of investigation on a NodeJS app before, but I’ve done it many times in C and C++, so I had an idea as what to expect. In fact, it was much easier than I thought it would be.
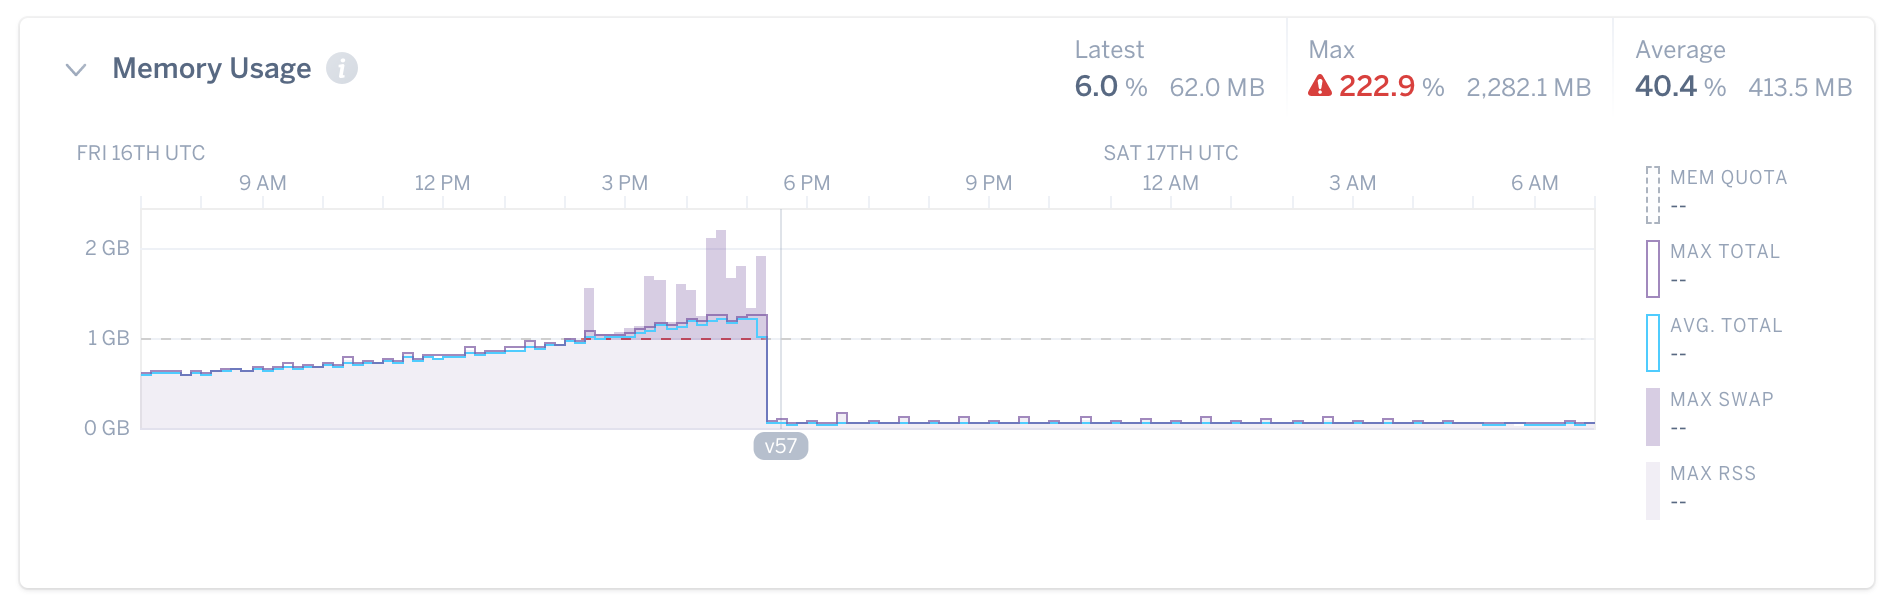
This is how it was working after I deployed the solution:
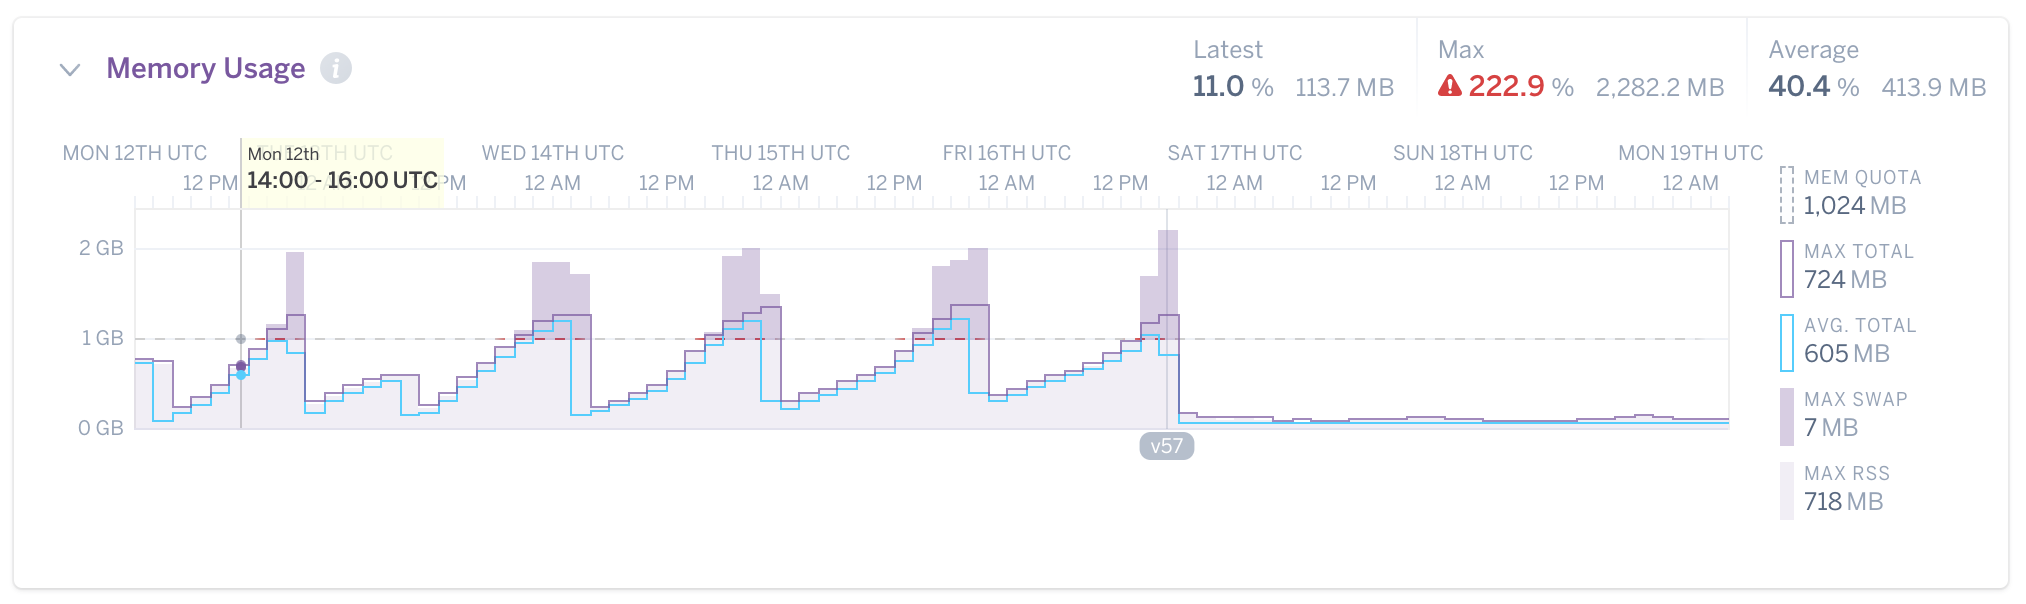
And this is some days later. Beautiful don’t you think?
Now let me tell you the story from the beginning. Once upon a time… :)
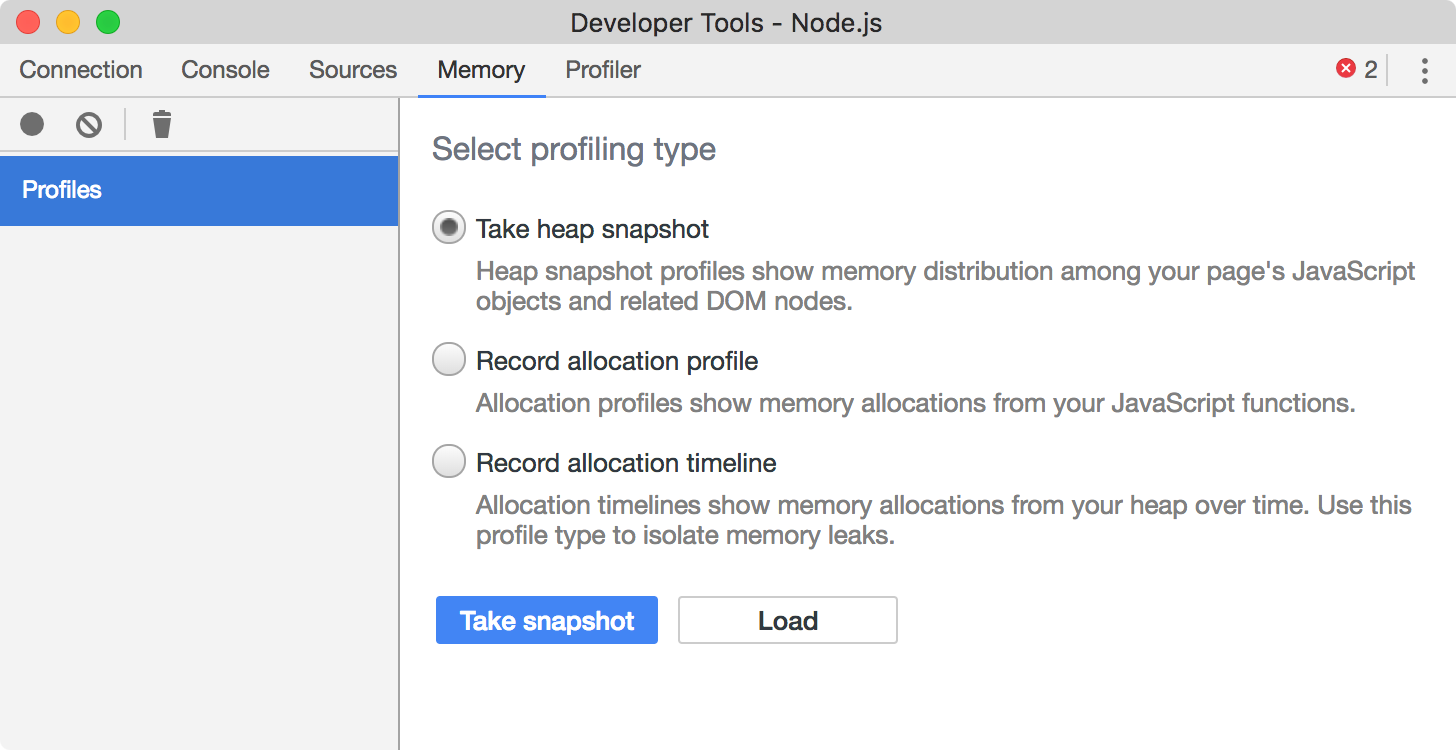
The first thing that I did was to take a heap snapshot using Chrome Dev Tools. Actually, as I was not familiar with the code, that was the only thing doable at that moment. The main problem of most tutorial on the Internet in my opinion is that they first create a leaky function with a known name to show their point, but in the real world, the object or function name may not mean much.
So I run the app in my local machine in the test environment with the --inspect option and opened the Chrome Dev Tools.
node --inspect app.js
Debugger listening on ws://127.0.0.1:9229/3e80809c-9ef8-4a2d-b402-5db73c30b7ed
For help see https://nodejs.org/en/docs/inspector
The secret here is to take two or more snapshots letting the memory leak occur between them and compare the snapshots. And we don’t need additional software for that. In my example the snapshots were ~2 minutes apart.
After taking the snapshots, select the second or beyond, chose comparison from the dropdown and order the list by the field Delta. The biggest deltas should be investigated.
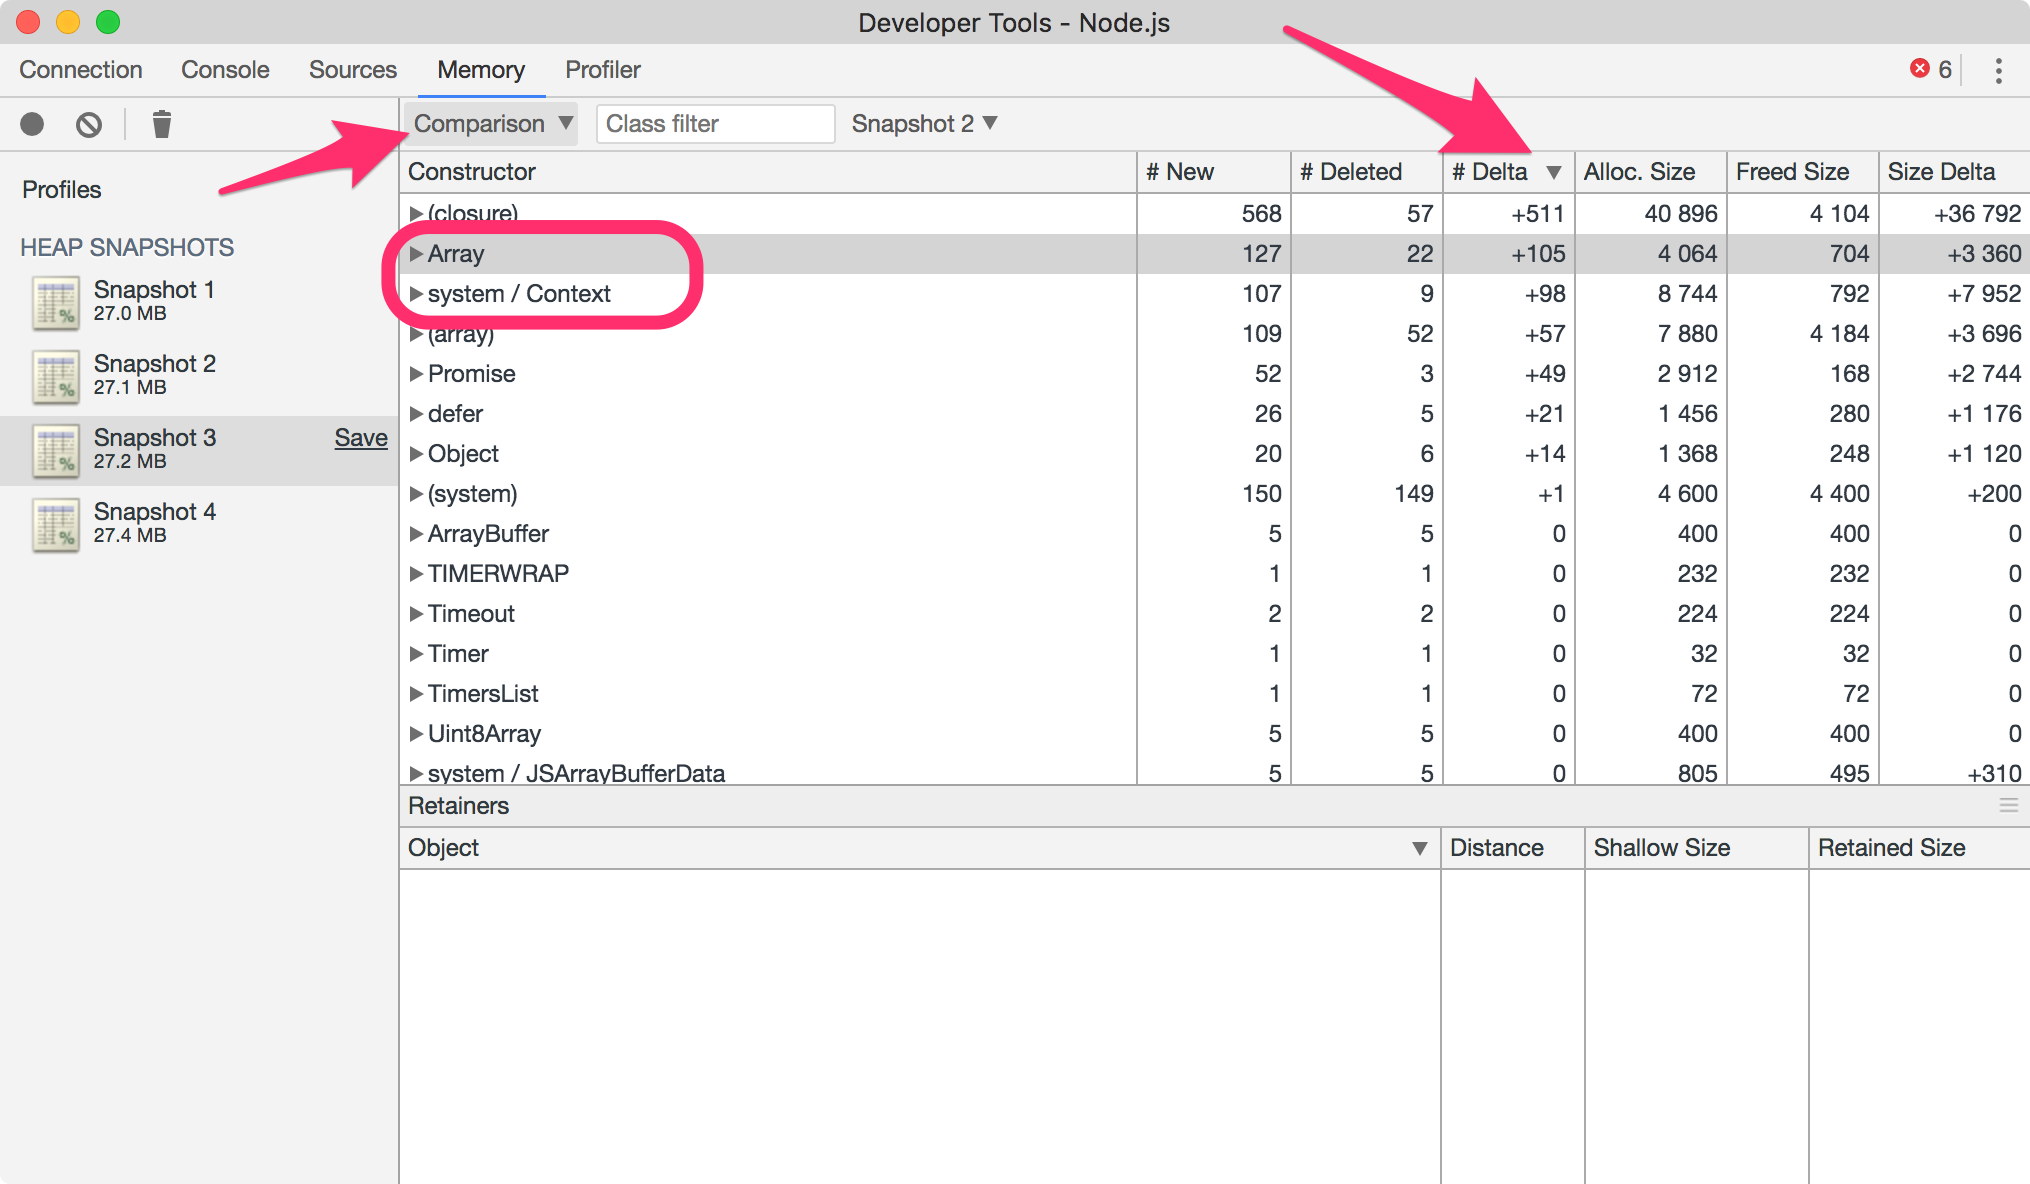
I did not find something useful in (closures), so I started looking into Arrays and system/context.
There I found many objects being retained by Promises and closures defer(). So I started digging into the usage of promises in the code.
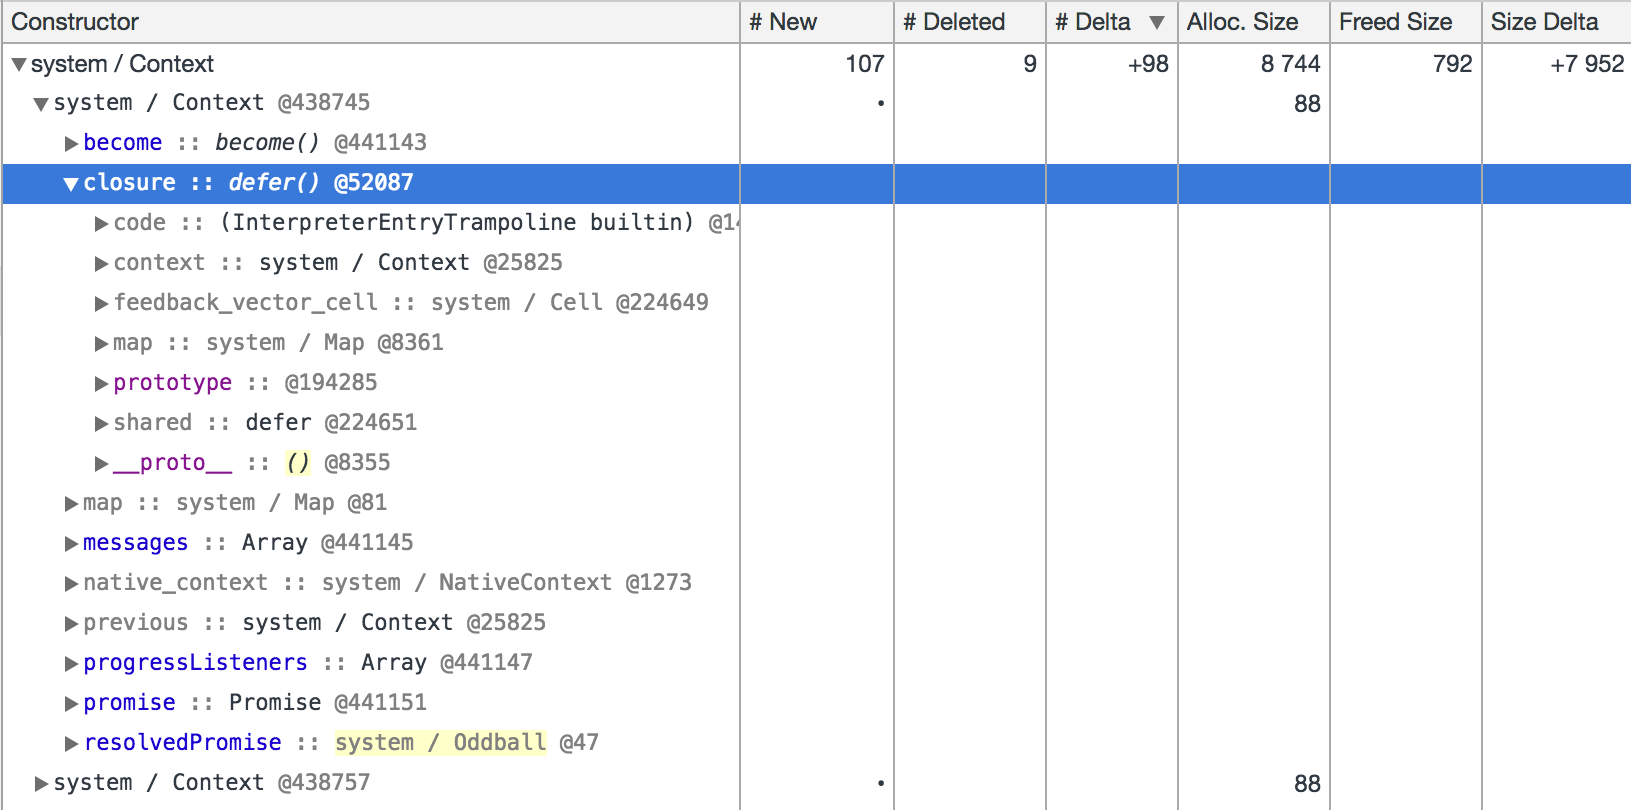
I noticed that the promises were being used as triggers to events and sometimes the promise was discarded without being rejected nor resolved.
var trigger = Q.defer();

var resetTrigger = function() {
  trigger = Q.defer(); //Replaces the trigger without resolving
}
And also this weird “loop”:
function doWork() {
    Q.any([trigger.promise, timer.promise, email.promise]) // global promises
      .then(function () {
        var job = getNextJob()
        resetTrigger();
        resetTimer();
        job.doIt()
          .then(() => {
            doWork();
          })
          .fail((err) => {
            job.markAsFailed();
            doWork();
          });
      })
};
doWork(); // Start the loop
I was convinced that the problem was it. So what I did then was to replace this pattern with the use of EventEmitter
The same goal has been achieved by the code below:
import { EventEmitter } from 'events';
const jobberEmitter = new EventEmitter();

jobberEmitter.on('event', function (reason) {
  doWork(reason);
});

jobberEmitter.emit('event', 'start')

function doWork (reason) {
  let job = getNextJob(reason)
  job.doIt()
    .catch((err) => {
        job.markAsFailed();
    });
};
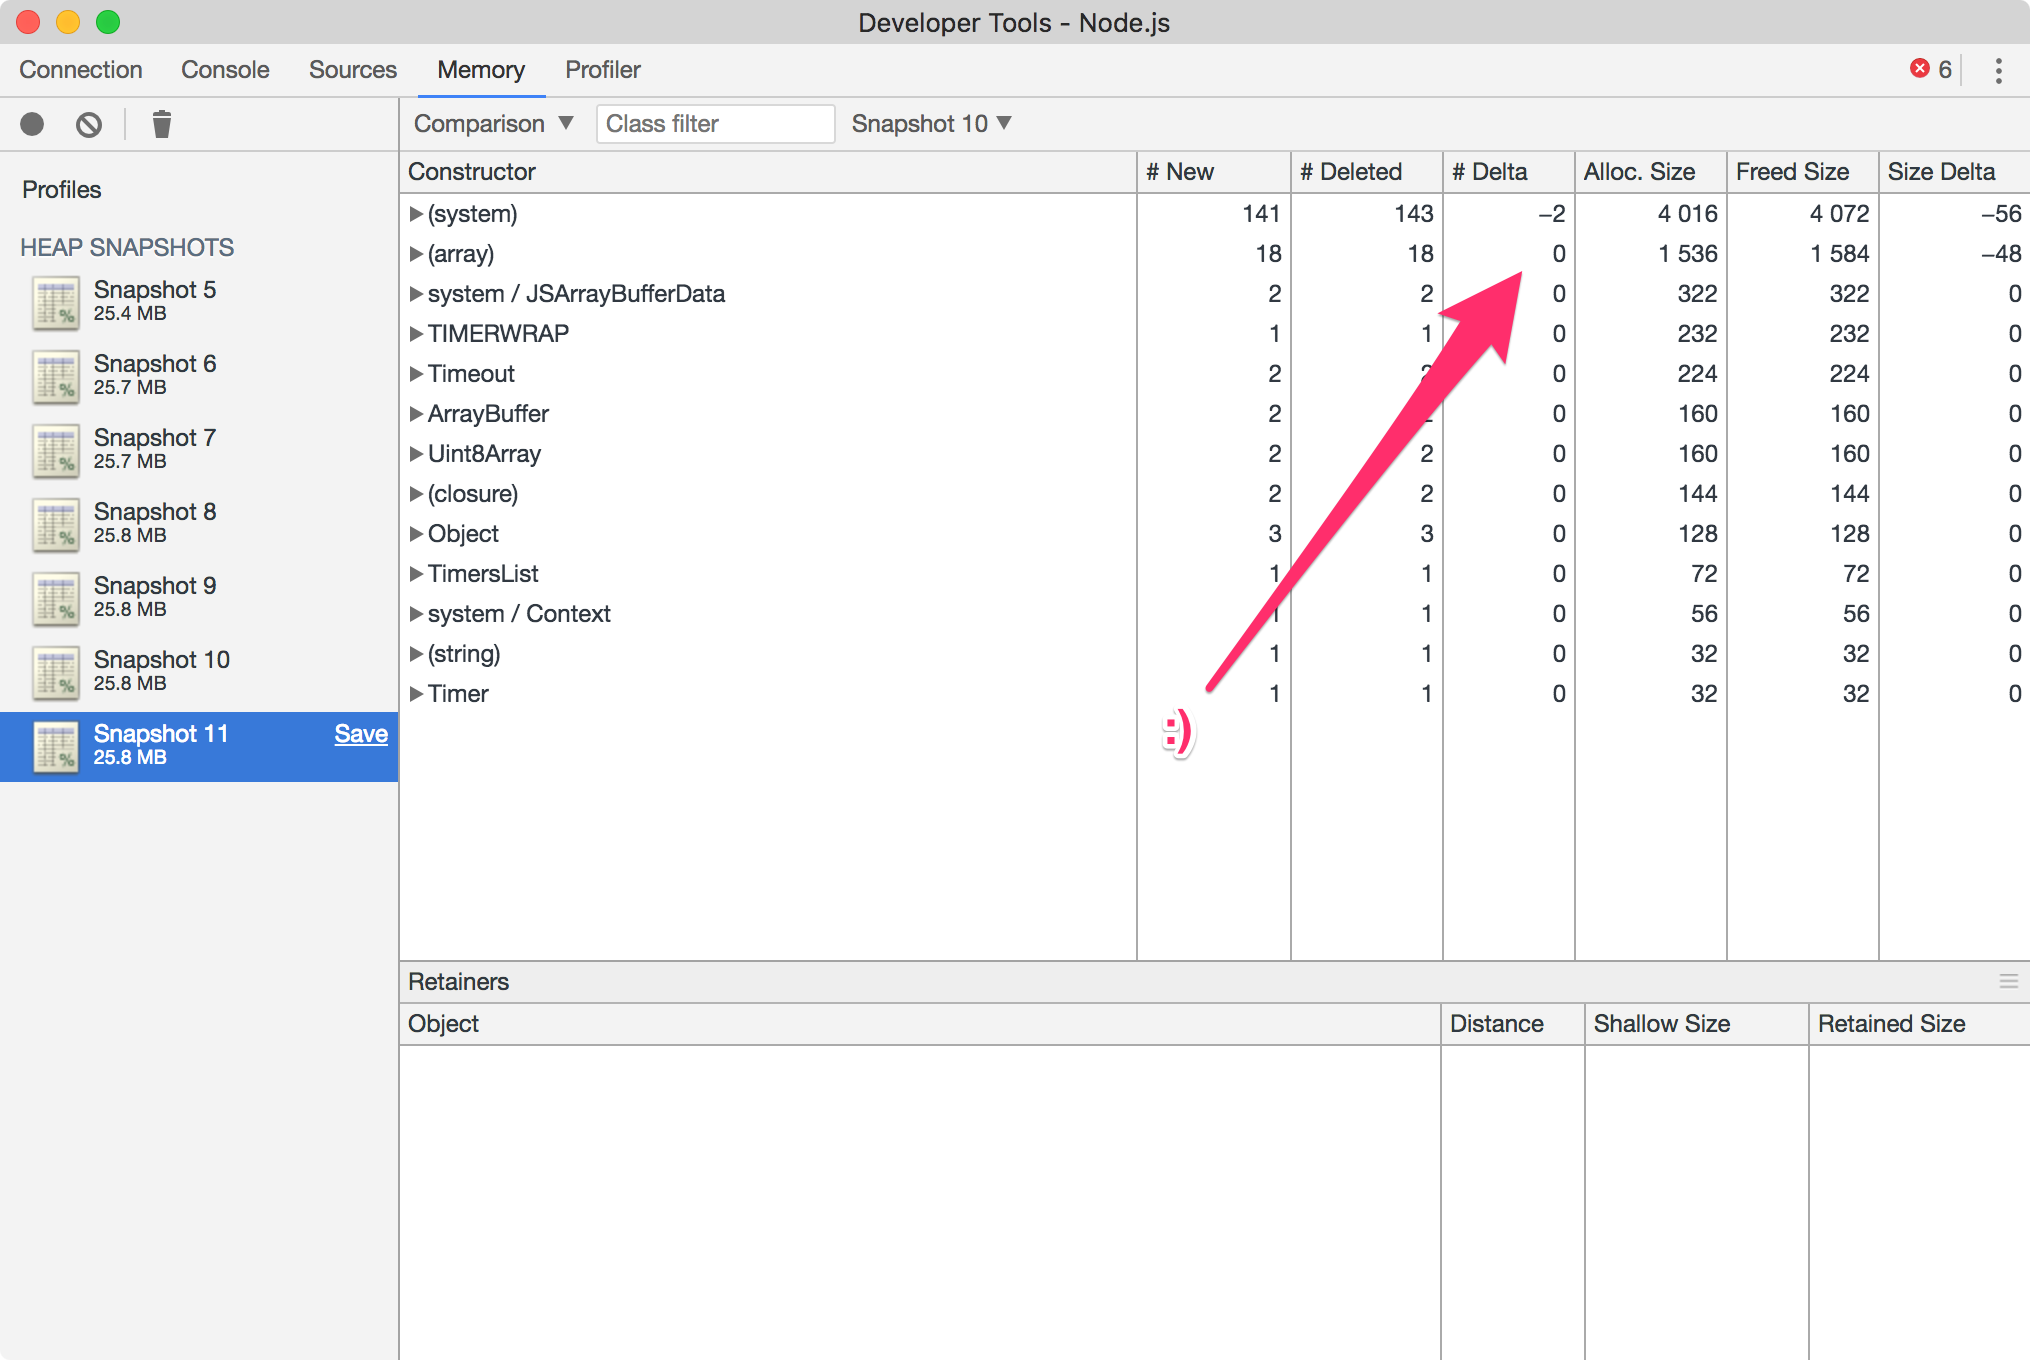
And the most important thing, the memory leak is gone. The snapshot comparisons now displays deltas way nicer.
After testing and deployed the tweak, the memory consumption chart on Heroku instantly dropped to 10% of the usual level and kept like that, as shown in the first picture of this article.